FAQ
Content Encoding
We enforce gzip content compression on the data being received by the endpoints. When "content-encoding" header is set to "gzip", the content body data will be compressed into a stream using gzip format and set to the request body. Therefore upon receiving the request on our endpoints, we must decompress the stream from the request body. Below is an example of how we are decompressing on our own endpoints.
string encodingType = Request.Headers["content-encoding"];

Stream decompressionStream = new GZipStream(Request.Body, CompressionMode.Decompress);

// Copy decompress stream into a new stream
MemoryStream outputStream = new MemoryStream();
decompressionStream.CopyTo(outputStream)

// Write stream to byte array
byte[] decompressedData = outputStream.ToArray();

// Decode byte array to string
string decompressedBody = Encoding.UTF8.GetString(decompressedData);

// Close the streams to do final buffer flushing
decompressionStream.Close();
outputStream.Close();
Heartbeat
Once started, webhooks will send out a heartbeat event every 5 minutes. This serves to inform clients that the webhook is operational and to verify the status of the receiving endpoint, ensuring there are no network or system issues.
The heartbeat event will look like the below
{
  "subscriptionId": "2fc686a1-123b-400f-86d6-356fcd39372d",
  "sessionId": "079d1e3a-ab87-4f87-8e22-4f4d15d68806",
  "attemptNumber": 1,
  "records": []
 }
Retry Policies
When a webhook delivery fails, the system will automatically retry depending on the type of error returned by your endpoint.
Retriable Errors
The following HTTP response codes trigger automatic retries. These are all temporary or infrastructure-level failures where the issue is likely to resolve on its own:
| HTTP Status | Name | Why It's Retriable |
|---|---|---|
| 408 | Request Timeout | Your endpoint didn't respond in time — could be a momentary slowdown. |
| 500 | Internal Server Error | A generic server-side failure that may clear after a brief recovery. |
| 502 | Bad Gateway | An intermediary (load balancer, proxy) couldn't reach your server — often transient. |
| 503 | Service Unavailable | Your server is temporarily overloaded or undergoing maintenance. |
| 504 | Gateway Timeout | An intermediary timed out waiting for your server — similar to 408 but at the network layer. |
How Retries Work
Retries use a linear backoff strategy — the wait time between attempts increases by 30 seconds each time:
| Attempt | Wait Time |
|---|---|
| 1st retry | 30 seconds |
| 2nd retry | 60 seconds |
| 3rd retry | 90 seconds |
| 4th retry | 120 seconds |
| ... | +30s each |
The total number of retry attempts depends on your webhook tier:
| Tier | Max Retries | Approximate Total Retry Window |
|---|---|---|
| Starter | 1 | 30 seconds |
| Small | 10 | ~27 minutes |
| Medium | 20 | ~1.75 hours |
| Large | 50 | ~10.6 hours |
If all retries are exhausted, the webhook moves to a Failed state.
Non-Retriable Errors
For responses like 400 Bad Request, the webhook will fail immediately without retrying. These errors typically indicate a configuration or implementation problem on the receiving endpoint that won't resolve on its own.
What to do: Fix the issue on your endpoint and then manually restart the webhook from the UI.
Tips
- If you're seeing frequent retries, check your endpoint's availability, response times, and authentication configuration.
- Upgrading your tier increases both the retry count and overall recovery window.
Record Batching
Events are grouped into batches before being delivered to your endpoint. A single batch can contain different events from the same category (e.g., TrainingAssigned and TrainingCompleted in one delivery).
Batch Size Limits
The maximum number of records per batch depends on your webhook tier:
| Tier | Max Records Per Batch |
|---|---|
| Starter | 10 |
| Small | 100 |
| Medium | 500 |
| Large | 1,000 |
For full tier comparison including throughput rates and parallelism, see Infrastructure Tiers and Throughput.
When Batches Are Dispatched
A batch is dispatched to your endpoint when either of the following occurs — whichever comes first:
- The batch is full — once the maximum record count for your tier is reached, the batch is sent immediately.
- No more events are available — if the batch is only partially filled and there are no additional events to collect, it is dispatched rather than waiting indefinitely.
Under light load, you'll typically receive smaller batches delivered quickly. Under sustained high load, batches will consistently fill to the tier maximum and dispatch continuously.
What This Means in Practice
- Batch sizes will vary — don't expect every delivery to contain exactly the maximum number of records.
- There is no fixed "wait X seconds then send" timer. The system optimizes for both low latency and efficient delivery.
- If you need to handle high-throughput scenarios with fewer, larger deliveries, consider upgrading your tier.
Initial Webhook Start
Once the webhook feature is enabled on a client portal, event generation begins and events are stored based on the retention period. When a webhook is started, all events stored will be delivered from the beginning of the collection. This means upon initial start of a webhook, there may be a backlog of events to be delivered, resulting in increased load and latency. This should subside as long as the events are delivered successfully to the client endpoint.
Training Event Timing
Training webhook events (such as TrainingAssigned) fire when an enrollment becomes actionable, not necessarily at the moment of initial assignment. The time between assignment and event delivery depends on the assignment source and any workflow gates configured for the learning object.
Expected delivery timing by scenario
| Scenario | Expected Latency | Description |
|---|---|---|
| Direct assignment | < 10 seconds | Standard assignment with no gates |
| Approval-gated LO | Hours to days | Event fires after manager or workflow approval is granted. Delay reflects human action time. |
| Priced LO (purchase flow) | Seconds to minutes | Event fires after the learner completes the purchase/checkout process |
| External content provider | Variable | For aggregated content (e.g., third-party providers), event timing depends on when the upstream provider confirms enrollment |
| Bulk import | Minutes | Assignments processed via bulk import queue behind additional processing layers |
Implications for the lag field
The lag field in the webhook payload reflects the time between when the event was generated internally and when it was delivered to your endpoint. For approval-gated or purchase-flow content, the event is not generated until the gate clears — so lag will not include approval wait time. However, if you are comparing the webhook delivery timestamp to the original assignment timestamp in a report, the difference will include the full workflow wait time.
Registration numbers
Learning objects that support multiple registrations (e.g., recurring training) will produce separate events for each registration. When comparing assignment and completion timestamps across registrations, ensure you are matching events to the correct trainingRegistrationNumber to avoid apparent timing discrepancies.
Alerts Types
Alerts are a webhook event category that allows end users to setup webhooks in order to better alert and monitor their webhooks.
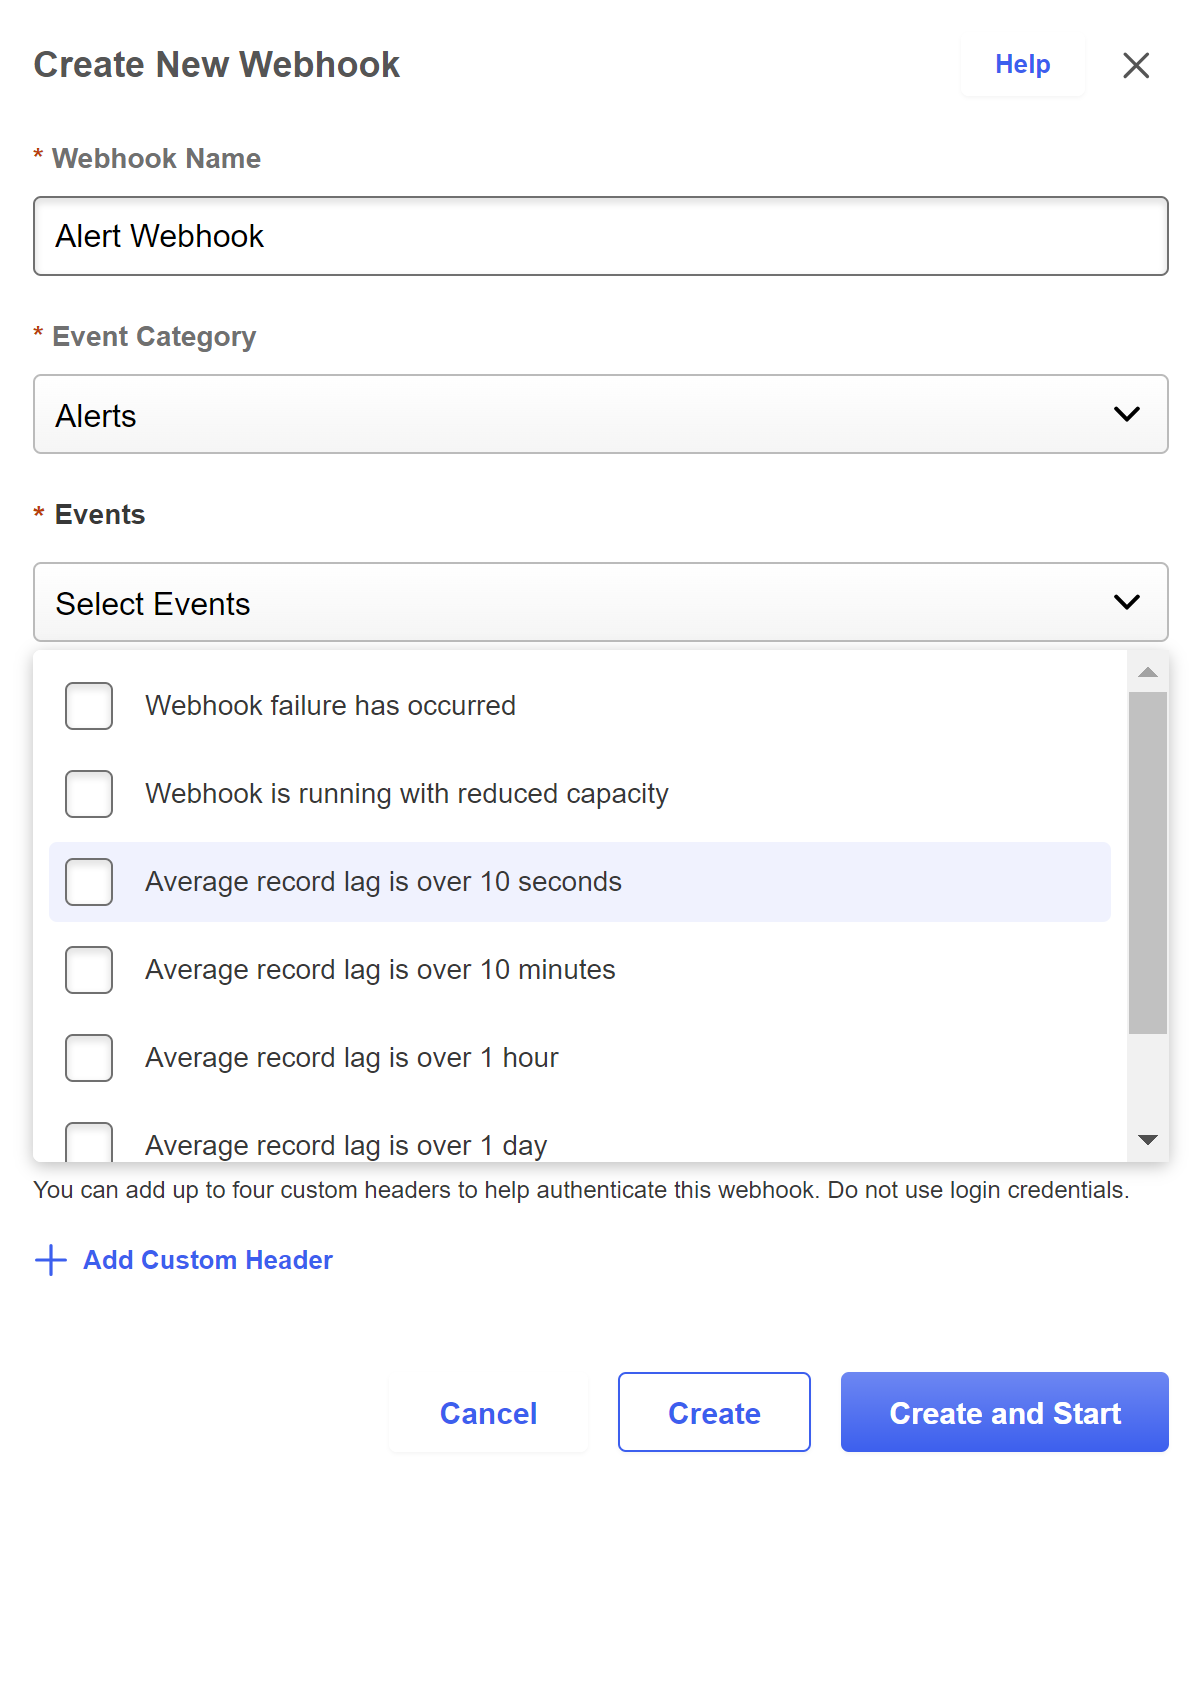
Types of Alerts
Webhook failure has occurred
When the webhook moves into a failed state, a Failed alert event will be sent. Generally this will occur due to issues with the client's endpoint that needs to be acted upon. On the UI, a warning icon will be displayed which will describe the error (e.g. HTTP status code: Unauthorized). In this example, the client endpoint assigned to the webhook is throwing an Unauthorized error and the client should take action to resolve it before restarting the webhook manually.

Webhook is running with reduced capacity
Based upon the client's tiering, a client's webhooks may have up to 4 sessions to process their throughput. In the case where 1 or more of these sessions are not running for 30 minutes, a ReducedCapacity alert will be triggered. This indicates a partial failure and the webhook may likely end up in a failed state entirely. The client may want to pre-emptively stop and restart the webhook if the issue is with the client's endpoint.
Average record lag alerts
Lag alerts are triggered when the average record lag exceeds a threshold over a 30-minute window. The following thresholds are monitored:
| Alert | Threshold |
|---|---|
| LaggingOver10Seconds | > 10 seconds |
| LaggingOver10Minutes | > 10 minutes |
| LaggingOver1Hour | > 1 hour |
| LaggingOver1Day | > 1 day |
Lag is most commonly seen during the initial start of a new webhook when there is a backlog of events to process. If lag alerts persist under normal operation, consider upgrading your tier to handle higher throughput.
Note: For training events, lag alerts may reflect approval workflows, purchase/checkout flows, or external content provider latency rather than system throughput constraints. These are expected workflow-driven delays and upgrading tiers will not reduce them. See Training Event Timing for details on expected delivery timing by assignment source.
No heartbeat detected
Webhooks produce a heartbeat event every 5 minutes in order to inform consumers that the webhook is running. When the last recorded heartbeat update is more than 30 minutes from the current time, the NoHeartbeat alert will be triggered. This will occur repeatedly until action is taken (such as a restart). When the NoHeartbeat alert is triggered, Cornerstone automatically restarts the Webhook.
Example payloads for all of the events above can be found at Alerts Events Reference
Status Types
In the Webhooks system, we provide the ability to create a external webhook to consume the webhook status stream. This allows clients to monitor the status of their webhooks via a webhook.
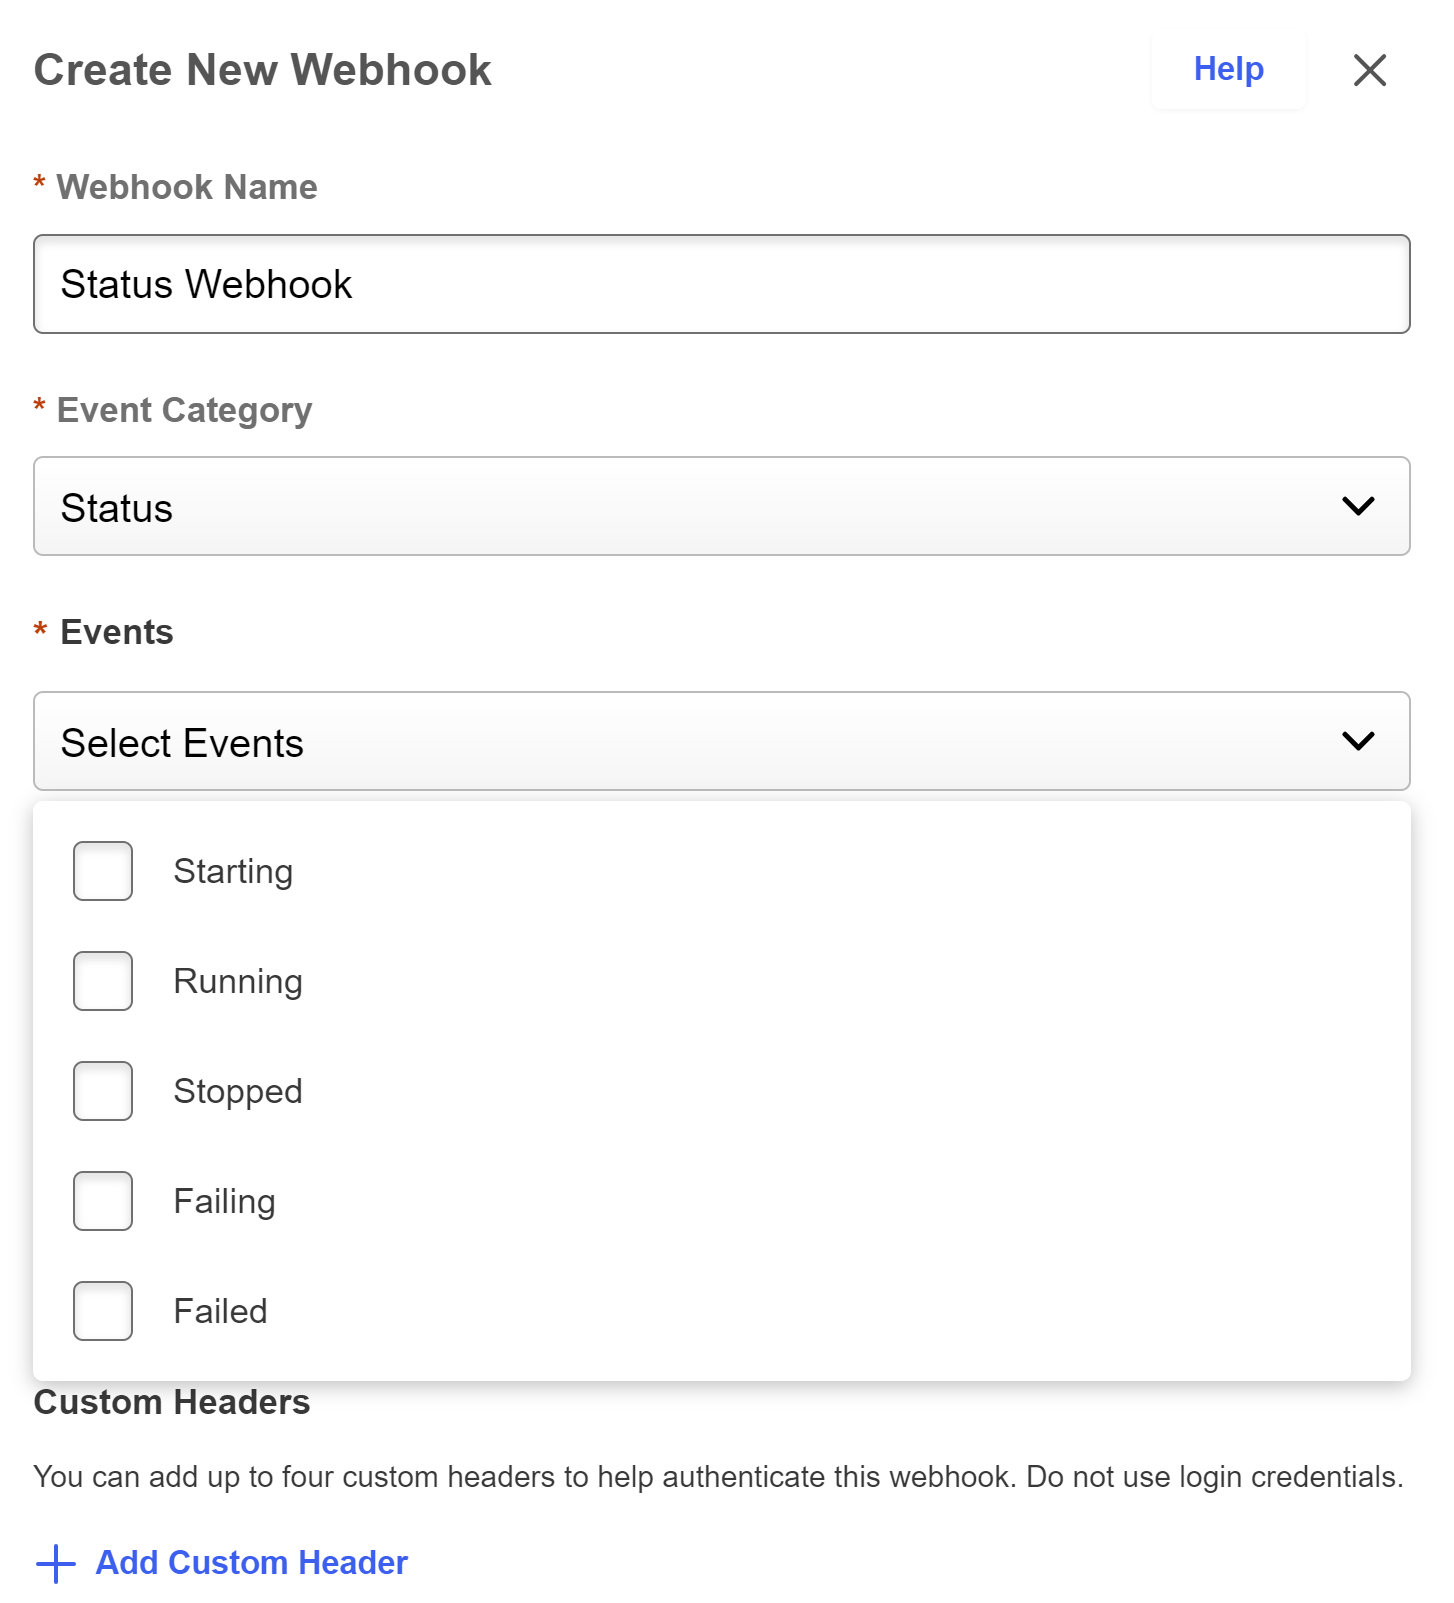
Types of Statuses
Starting
This status is produced when the webhook has just been started from a stopped status. Generally seen when someone creates and starts a webhook from the UI.
Running
This status is produced when the webhook has been running and a heartbeat event has occurred. This will generally occur every 5 minutes from the start of a webhook, though there may be some times, where the event will be missed (generally around the start of a webhook and during the 1 hour session renewal).
Stopped
This status is produced when the webhook is put into a stopped state. Generally this will be when the webhook has been stopped manually.
Failing
This status is produced when the webhook is put into a failing state. Generally occurs if the webhook has been trying to send events to an endpoint who is in turn throwing a retriable event. See Retry Policies
Failed
This status is produced when the webhook is put into a failed state. Generally occurs if there is a client error (most common) on the client endpoint or an error has occurred from the CSOD webhooks system.
Example payloads can be found in Status Events Reference